data visualization + information design
Current highlight
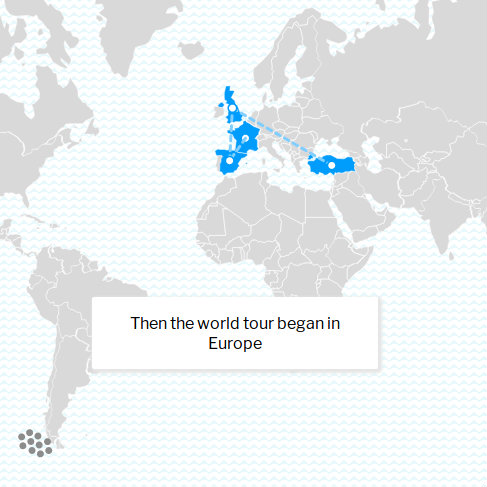
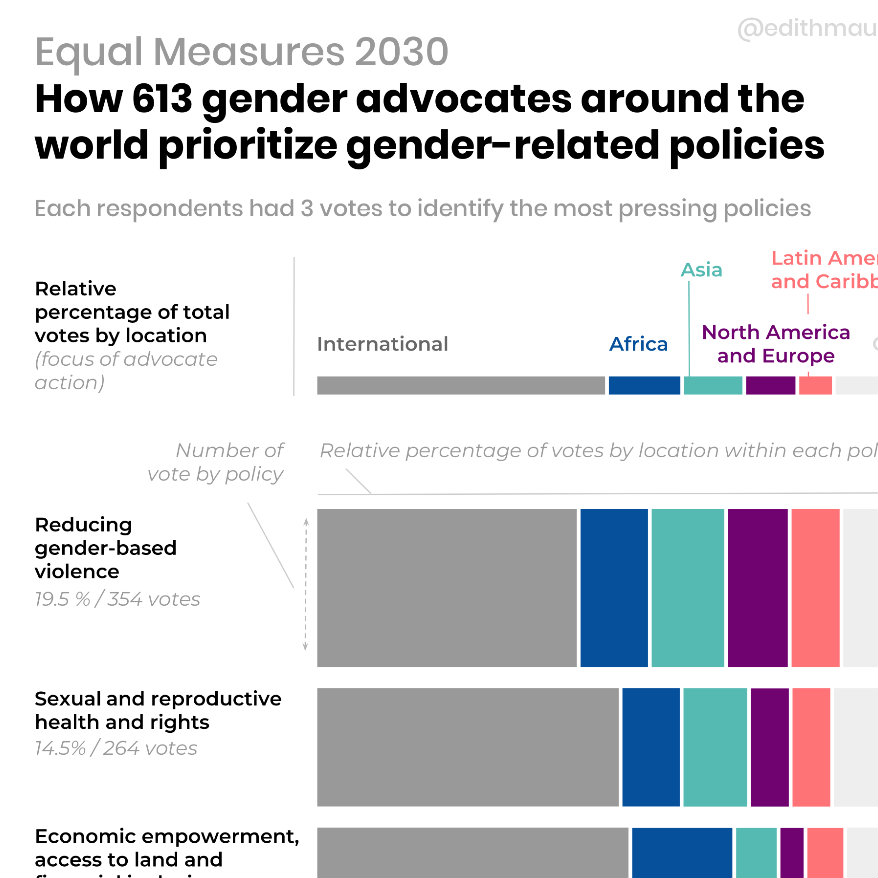
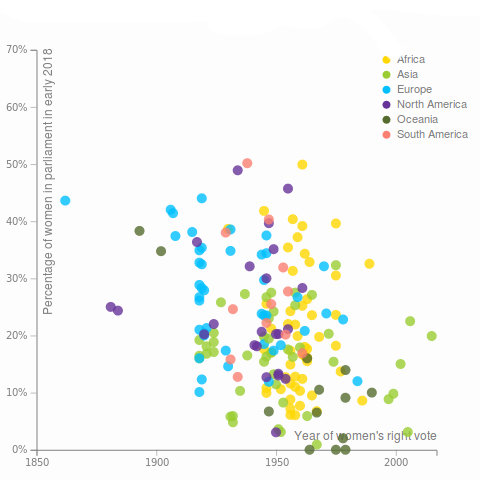
Telling the story of 20 questions to the world project
When you discover a project you are passionnate about and want to spread the word : it’s the best time to learn scrollytelling ! I worked as a volunteer with the project’s founder to clean, process and visualize the collected data. This is a visual story of 20 questions to the world.
Tech : Scrollytelling, d3, webpack
Clients' projects
Data Visualization class
planned - September 2020
18 hours of teaching ‘Introduction to Data Visualization’ class to data & computer science engineer students
Tech : python, d3, js
Keshif
completed - 2019
Data processing and cleaning. Design, prototype and implementation of several cutsomed charts for an end-user client.
Tech : d3, js
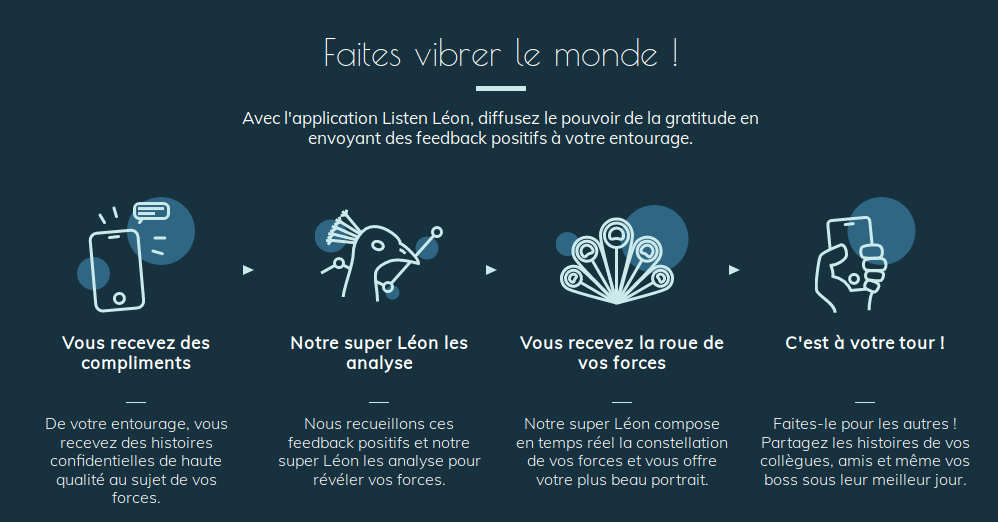
Listen Leon
completed - 2019
Design, co-creation and prototype of the new team profile view to trigger wonder and more diverse feedback writings.
Tech : d3, react
UFRIST de Bordeaux
completed - 2019
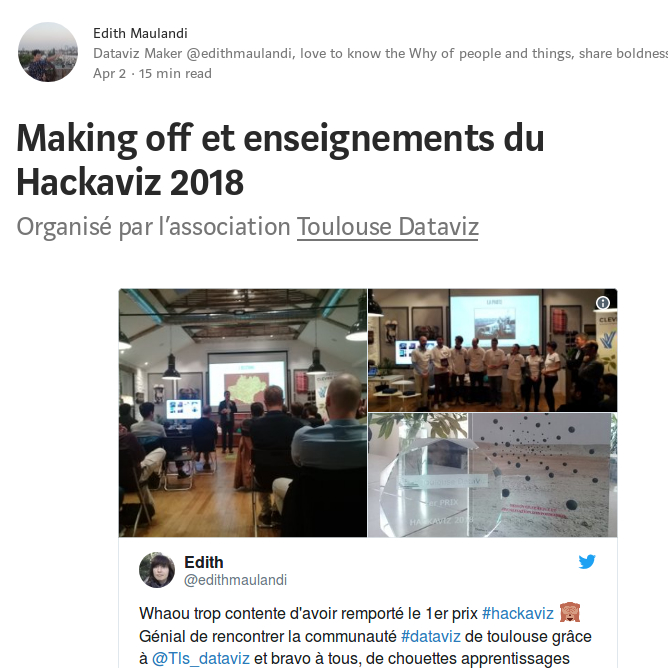
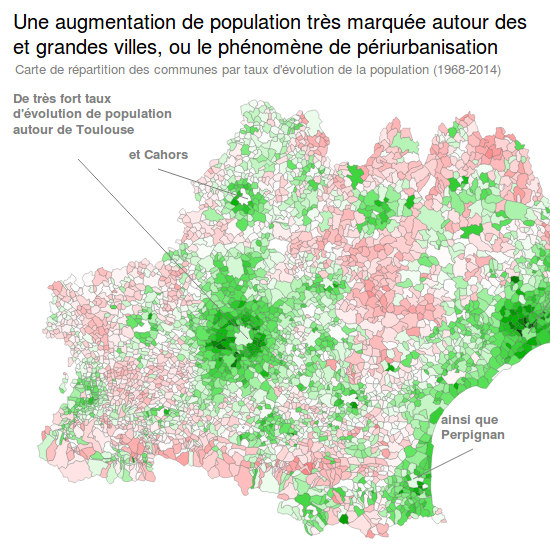
Co-creation of a one-day dataviz workshop for researchers with Christophe Bontemps, combining theory and practice with a data visualization hackaviz.
Tech : R, Python, facilitation
INRA
completed - 2019
Dataviz helper in a research group building an exploratory visualization tool to visualize yeast and bacterias presence & spreading in fermented foods.
Tech : R, Shiny
Makina Corpus
completed - 2018
Dataviz helper in a team prototyping a territorial information system
Tech : reactvis, kepler.gl